Applicable version(s):
by Marina Piccinelli, Math CS Department, Emory University, Atlanta, US
Topic
This tutorial illustrates the steps for the digital removal of a saccular cerebral aneurysm from its parent vasculature. The framework of the algorithm was originally proposed in Ford et al, An objective approach to digital removal of saccular aneurysm: techniques and applications. BJR, 2009, ss55-61. It was successively implemented in vmtk by Marina Piccinelli.
The algorithm relies on the definition of Voronoi Diagram and on its properties, particularly on the fact that given the model surface its Voronoi Diagram can be derived and vice versa.
Requirements
This tutorial is based on three Python scripts located in the vmtkApps directory in the source code (vmtk/vmtkApps/CerebralAneurysms/ParentVesselReconstructions). You can get the source code for vmtk here.
The programs are written make use of VTK and vmtk, which have to be installed for the scripts to run properly. Only the first script requires input data from the user, while the second and third steps read datasets and files created and saved along the various steps.
The initial input files and those created successively will be put in the same directory and an ID will be used to handle the case at hand. Eventually only the directory path and the ID will be provided to the scripts together with high-level information about the case (i.e. terminal vs lateral) or option selections (i.e. smoothing on vs off). The scripts will directly read in the given directory the needed files whose names are predefined with the exception of the ID as prefix (e.g. id_model.vtp, id_voronoi.vtp, etc).
Description
The removal of the aneurysm sac is performed in three successive steps, each one implemented in a separate python script.
-
patchandinterpolatecenterlines.pyIdentification of points along the artery centerlines that define the area of influence of the sac on the parent vasculature, removal of the portion of centerlines between these points and creation of a new interpolated parent artery centerline; -
clipvoronoidiagram.pyRemoval from the complete Voronoi Diagram of the surface model of the portions related to the aneurysm sac and the parent artery lying underneath it; -
paralleltransportvoronoidiagram.pyReconstruction of a new Voronoi Diagram for the portion of parent artery just removed; this operation is performed parallel transporting Voronoi points at one end of the empty region to the other extreme following the interpolated centerlines.
Given the high morphological variability of real cases, many auxiliary objects and files are created along the execution of the programs; they allow checking of the results and, in case, tuning of tolerances.
Dataset
The two models used to illustrate this tutorial are id1_model.vtp for lateral and id2_model.vtp for terminal. They are taken from the Aneurisk dataset.
Detailed Description and Instructions
Surface model and Voronoi Diagram.
The triangulated surface mesh of the aneurysm and its close vasculature and the corresponding Voronoi Diagram are the only data needed to start the procedure. Files have specific names in order for the scripts to directly read them inside the given directory.
Given the surface model (id_model.vtp), its Voronoi Diagram (id_voronoi.vtp) can be computed by means of vmtkdelaunayvoronoi:
vmtkdelaunayvoronoi -ifile id1_model.vtp -removesubresolution 1 -voronoidiagramfile id1_voronoi.vtp
The -removesubresolution is selected to remove from the Voronoi Diagram points centered at very small spheres that may generate surface artifacts when the inverse procedure is performed, i.e. from the Voronoi Diagram to the surface. The default subresolutionfactor should be fine in most of the situations, but it strongly depends on the smoothness of the surface model.
Centerlines
The scripts proceed in a slightly different way depending on weather the aneurysm to be removed has a lateral or a terminal configuration. Specifically designed centerlines are extracted with vmtkcenterlines by manually placing seeds on the model.
Lateral configuration:
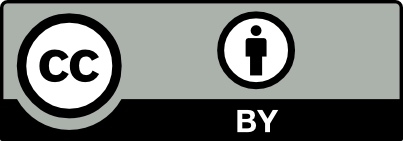
Two couples of centerlines have to be provided. They are extracted from the model from the input section to the aneurysm dome and the output - forward direction, id_forwardcl.vtp - and from the output section to the aneurysm dome and the input - backward direction, id_backwardcl.vtp. Particular care has to be put in the order of selection of the target points in the two couples of centerlines (see Figures 1 and 2). More in details, for the forward direction the source point should be at the input section, the first target point should be placed on the aneurysm sac dome, while the following target points can be placed on one or more vessel output sections downstream the aneurysm. For the backward direction, any of output sections can be selected as source point, the first target point is still the aneurysm dome, and the second target point should be the model input section.
vmtkcenterlines -ifile id1_model.vtp -endpoints 1 --pipe vmtkcenterlineresampling -length 0.1 -ofile id1_forwardcl.vtp
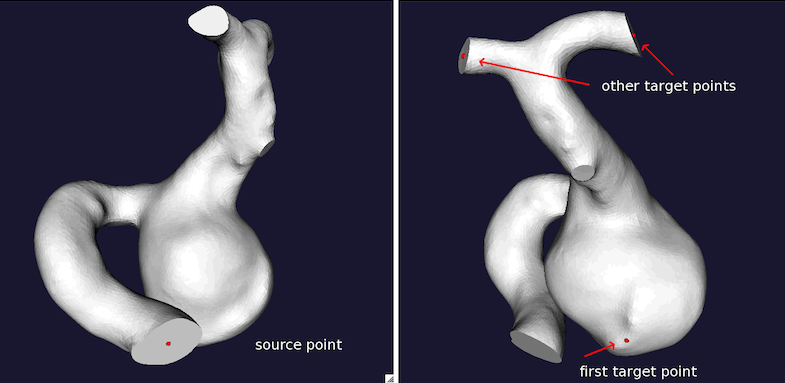
Figure 1
vmtkcenterlines -ifile id1_model.vtp -endpoints 1 --pipe vmtkcenterlineresampling -length 0.1 -ofile id1_backwardcl.vtp
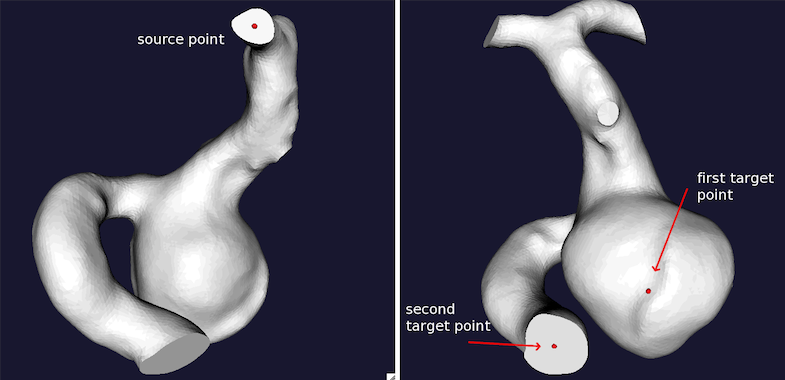
Figure 2
The resulting pairs of centerlines are displayed in Figure 3. Centerlines resampling at a small step is recommended.
Figure 3
Terminal configuration:
Three couples of centerlines have to be provided for terminal configurations: the physiologically correct parent vasculature centerlines (id_parentvessel.vtp) and two couples of centerlines travelling from one daughter artery to the aneurysm dome and the other daughter artery. For terminal aneurysms too some care should be put in the selection of source and target points. In the creation of the parent vessel centerlines (Figure 4A) the order of selection of daughter artery output sections, i.e. of target points, is not important per se, but the creation of the following centerline couples (id_dau1cl.vtp and id_dau2cl.vtp) should be coherent with this initial ordering. The artery where the first target point is placed will become the source point of the daughter 1 centerlines (Figure 4B), while the artery where the second target point is placed has to be the source point for the daughter 2 centerlines (Fig 4C). Centerlines are computed with vmtkcenterlines and the order in placing seeds should be carefully followed.
vmtkcenterlines -ifile id2_model.vtp -endpoints 1 --pipe vmtkcenterlineresampling -length 0.1 -ofile id2_parentvessel.vtp
(see Figure 4A)
vmtkcenterlines -ifile id2_model.vtp -endpoints 1 --pipe vmtkcenterlineresampling -length 0.1 -ofile id2_dau1cl.vtp
(see Figure 4B)
vmtkcenterlines -ifile id2_model.vtp -endpoints 1 --pipe vmtkcenterlineresampling -length 0.1 -ofile id2_dau2cl.vtp
(see Figure 4C)
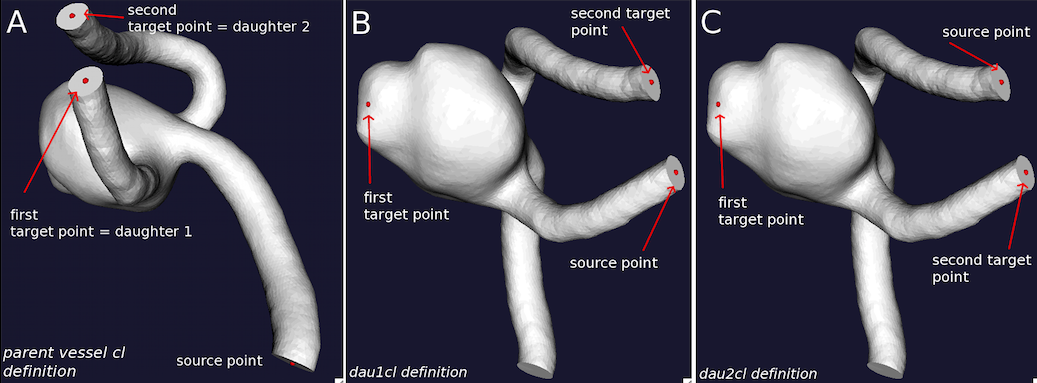
Figure 4
The resulting couples of centerlines are displayed in Figure 5. Centerlines resampling at a small step is recommended.
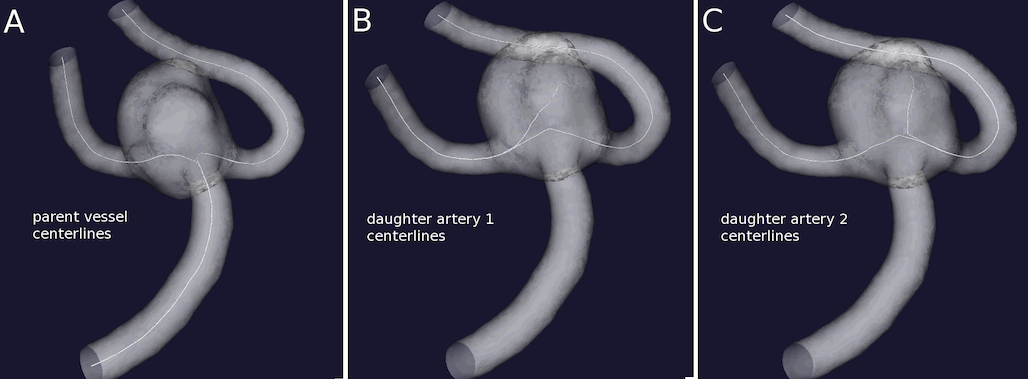
Figure 5
Centerlines interpolation (patchandinterpolatecenterlines.py)
The goal of this step is to identify on the given centerlines the locations delimiting the aneurysm sac. For each couple of centerlines the diverging point between the line entering the aneurysm and the one along the vessel is identified and the point one maximal sphere away from the aneurysm selected as clipping point. Eventually two clipping points are extracted for lateral aneurysms and three for terminal. The clipping points are identified on the parent vessel centerlines, the portion between them eliminated and re-created interpolating the remaining tracts.
Before this step, make sure that the python script are in your path or in your current folder and make sure that all the files for id1 are in an id1 folder and all files for id2 are in an id2 folder. If the id1 and id2 folder are also in your current folder, use . as directoryPath.
 python patchandinterpolatecenterlines.py directoryPath id1 lateral
 python patchandinterpolatecenterlines.py directoryPath id2 terminal
Figure 6A depicts the clipping points, Figure 6B the parent vessel centerlines without the tract underneath the aneurysm and Figure 6C the interpolated centerlines for the two type of aneurysm.
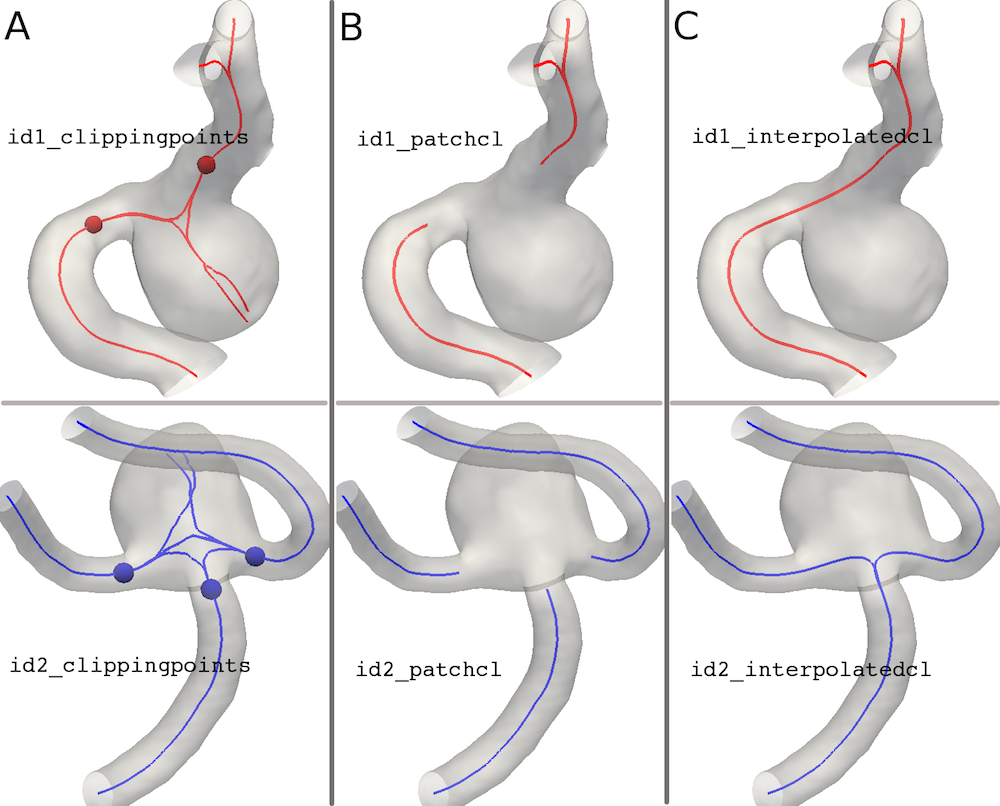
Figure 6
The script saves the following data whose names should be self-explanatory:
- id_divergingpoints.vtp
- id_clippingpoints.vtp
- id_patchcl.vtp
- id_interpolatedcl.vtp
Editing the script few options may be customized according to situations: setClippingPoints, divergingRatioToSpacingTolerance.
setClippingPoints = 0 (default) means that the clipping points delimiting the centerline tract to be eliminated and re-interpolated is calculated from the centerlines computed on the model.
setClippingPoints = 1 means that clipping points have to be saved in the case directory (id_clippingpoints.vtp) ad well as the parent vessel centerlines to be patched and interpolated (id_parentvessel.vtp)
divergingRatioToSpacingTolerance = 2.0 (default) controls the value of the divergingTolererance = clSpacing/divergingRatioToSpacingTolerance i.e. at what distance points on the two lines composing each centerline couple are diverging. clSpacing is imposed by the vmtkcenterlineresampling script. Tuning of these parameters allows to somehow control the positioning of the clipping points, which may in turn be helpful in some situations where the shorter the portion of centerline to be re-interpolated the better the final result.
Clipping of Voronoi Diagram (clipvoronoidiagram.py)
This script removes the Voronoi Diagram pertaining the aneurysm sac and the tract of parent vessel centerlines underneath it, i.e. between the clipping points. The scripts needs the complete Voronoi Diagram created from the surface model (id_voronoi.vtp) and the patched centerlines created and saved within the patcheandinterpolatecenterline.py script (id_patchcl.vtp).
 python clipvoronoidiagram.py directoryPath id1
 python clipvoronoidiagram.py directoryPath id2
In addition to removing the undesired parts of the Voronoi Diagram, a smoothing procedure is applied in order to remove from the whole diagram the points centered at very small spheres and typically affecting a vessel surface smoothness, not its dimension. The smoothing operation is highly recommended and directly enabled in the script by way of a Boolean variable smoothVoronoiDiagram set to 1. The smoothingFactor is a value between 0 and 1; its default value is set to 0.25, which means that Voronoi points whose radius is < 0.75 times the vessel local radius are discarded. In practice the higher the smoothingFactor the smaller the number of Voronoi Points discarded. The default value should work fine in most of the situations, even for irregular surfaces.
With the smoothVoronoiDiagram = 1, the script saves the following data:
- id_clippedvoronoi.vtp
- id_smoothclippedvoronoi.vtp
Figures 7A and B depict the Voronoi Diagram after clipping with and without smoothing for the two cases.
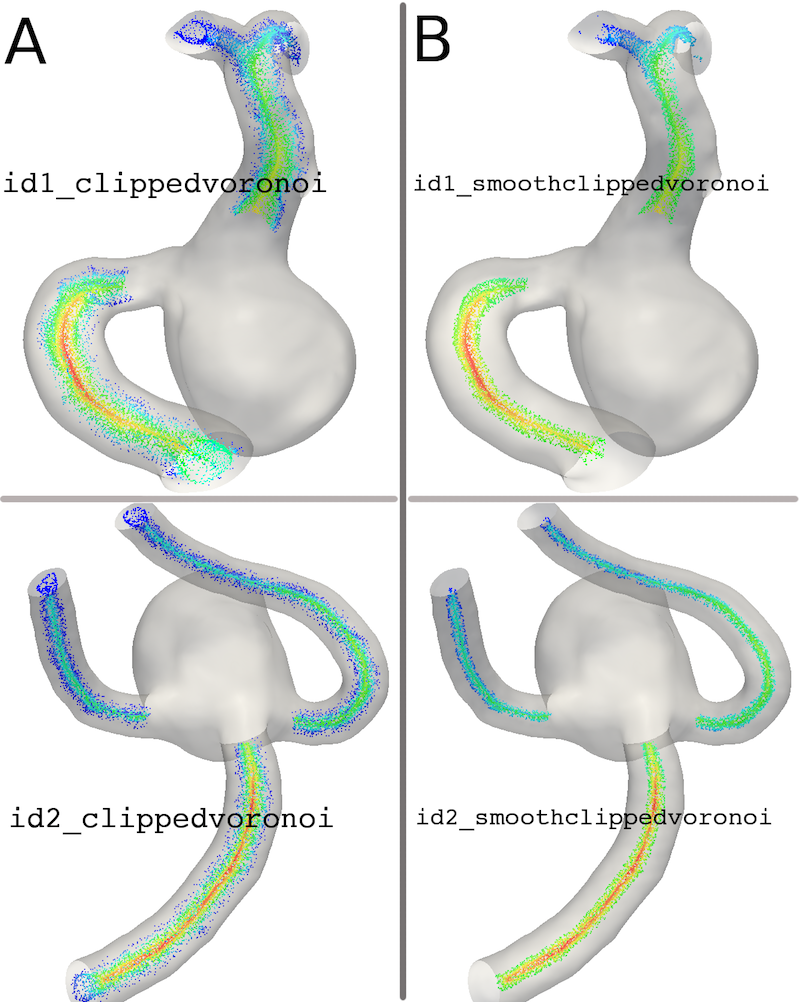
Figure 7
Interpolation of Voronoi Diagram and parent vessel model reconstruction (paralleltransportvoronoidiagram.py)
In this step the Voronoi Diagram is reconstructed in the region where it has been deleted. This operation is performed by parallel transporting Voronoi points from one end of the patched centerlines to the end(s) on the other side of the empty region following the trajectory of the interpolated centerlines and using the parallel transport normal system built on these centerlines as a guide. Once the Voronoi Diagram has been completed, the surface is recovered by means of the vmtk C++ class vtkvmtkPolyBallModeller that merges all the spheres into a surface. More in details, a 3D regular grid is constructed on the model bounding box and the position of the grid points probed with respect to the tube function constructed on the complete Voronoi Diagram (see Antiga and Steinman, IEEE Trans Med Imag 2004). The final surface is obtained as the zero level set computed on this image.
Both the id_smoothclippedvoronoi.vtp (suggested) and the id_clippedvoronoi.vtp can be used in the script. The third parameter (smoothVoronoi) taken by the script call indicates whether the smoothed Voronoi Diagram should be used for the interpolation (smoothVoronoi = 1) or not (smoothVoronoi = 0)
 python paralleltransportvoronoidiagram.py directoryPath id1 1
 python paralleltransportvoronoidiagram.py directoryPath id2 1
The script saves the following data:
- id_completevoronoi.vtp
- id_reconstructedmodel.vtp
The final result in terms of surface smoothness depends on the grid dimensions: a grid too fine may result in a very accurate mesh that follows all the merged spheres profiles. A grid too coarse may loose important surface details. The grid dimensions can be set by editing the polyBallImageSize variable inside the script. It’s a triplet of integers that represent the image dimensions on x, y and z directions.
Since the final reconstructed surface is the result of a marching cube operation, a remeshing step is required (i.e. with vmtksurfaceremeshing)
Figure 8A and B displays the interpolated Voronoi Diagram and the reconstructed surface.
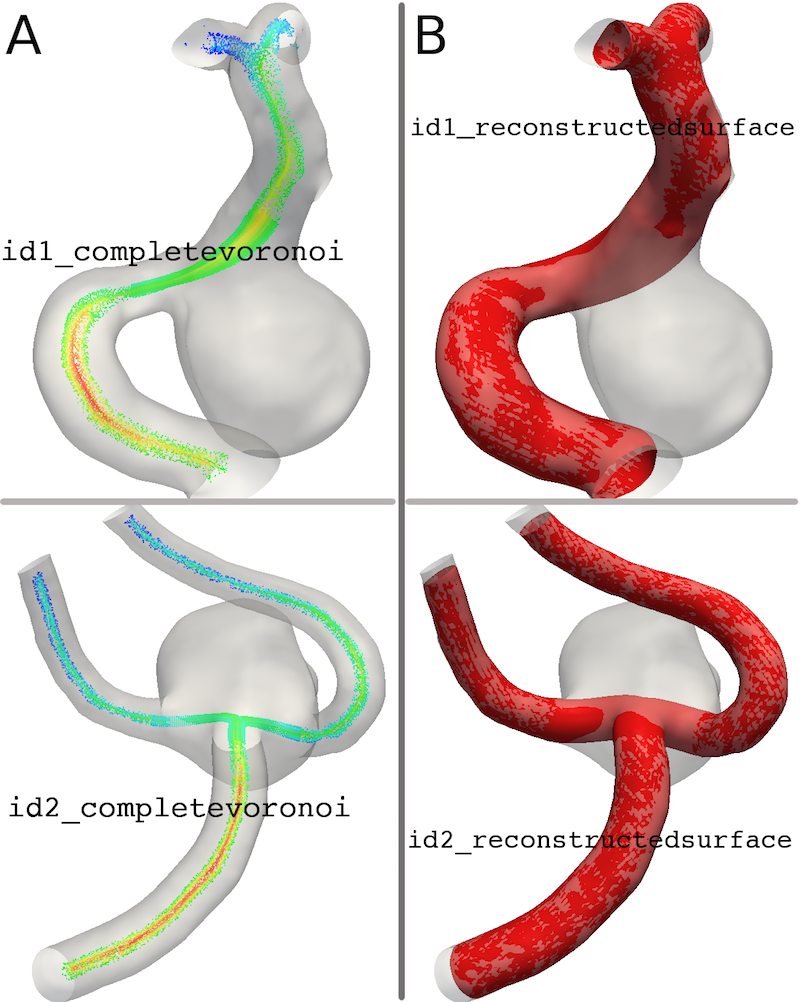
Figure 8