Applicable version(s):
This tutorial demonstrates how to convert VMTK Image, Surface, and Centerline object data to and from a structured dictionary of Numpy arrays. This tutorial can be viewed as a Jupyter Notebook at this link
Note: This is an advanced function meant only for users who wish to access & programmatically modify the underlying Visualization Toolkit (VTK) object data which defines Images, Surfaces, and Centerlines in VMTK. While the described vmtkscripts are valid PypeScript members, the API is designed to be called from a typical python script or from within a Jupyter Notebook. Also please note that as of VMTK version 1.3, the vmtkscripts described below are not included in the pre-built binary installer . In order to take advantage of these functions, please build VMTK from source by following this instructions here
Though deep expertise is not necessary, we recommend that users are familiar with the VTK data model and typical class structures for vtkImageData and vtkPolyData
Relevant VMTK scripts
Scripts that convert VMTK objects to numpy arrays:
Scripts that convert a nested dictionary of numpy arrays to VMTK objects:
Convenience scripts to write and read a nested dictionary of numpy arrays to disk:
Requirements
In addition to the standard VMTK package, the following packages must be installed and available on the users PATH:
We recommend using the Python Anaconda package manager to create a virtual environment and install the packages. Installation and quickstart instructions are available here.
A Primer on VTK Data
VMTK is built on top of Kitware’s Visualization Toolkit data model & processing pipeline. A full description of the VTK data model format and pipeline is well beyond the scope of this tutorial. For those interested users, please refer to the following two resources:
- Data Structures in the Visualization Toolkit, Stefan Bruckner, Seminar Paper, The Institute of Computer Graphics and Algorithms, Vienna University of Technology, Austria
- The VTK Users Guide
For our purposes, we can think of any VTK data object as being composed of an organizing structure (ie. Points & Cells) and associated data attributes (Point Data & Cell Data).
Points & Cells
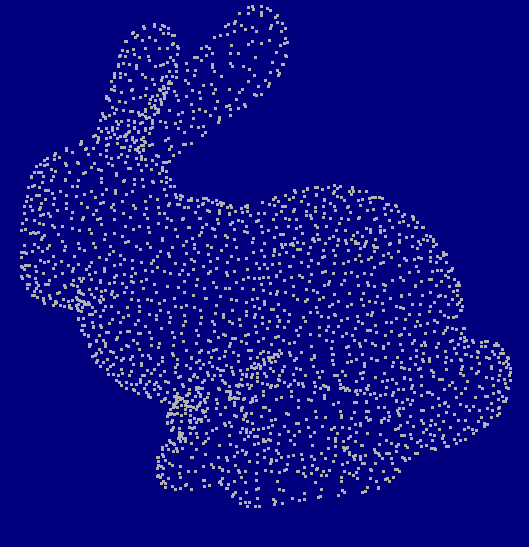
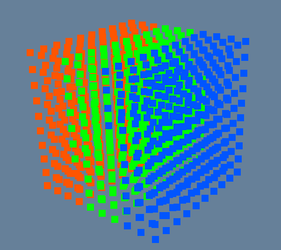
In this interpretation, we can think of Points as a vertices which define the geometry of the data object. For surfaces & centerlines, this interpretation is immediately intuitive; the geometry of these structures is composed of a discrete set of vertices (aka. Points) in 3D space (see Figure 1). To understand Points in the context of an image, we can think of any image as being composed of a structured grid of points in space with an intensity value at each point (see Figure 2)
 |
 |
| Figure 1: Illustration of vertices as Points | Figure 2: Illustration of image as points |
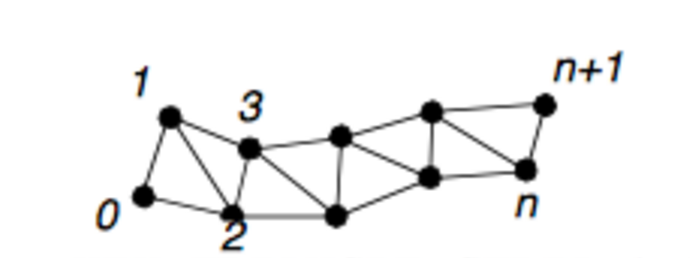
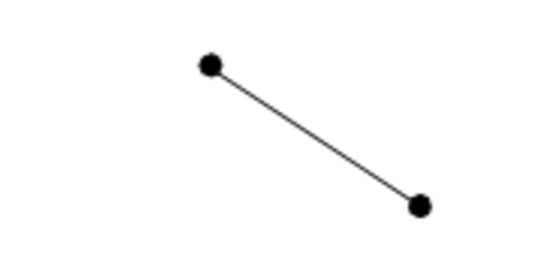
On the other hand, Cells define the topology of the data object. In the context of surfaces, this is a describes the connectivity of the vertices which form each triangle in the surface (see Figure 3). For centerlines, Cells describe the connectivity and grouping of points which make up the centerline data object (see Figure 4). Though in theory, cells can be used to group certain regions in vtkImageData, we do not define the concept of cells as it relates to a VMTK image.
 |
 |
| Figure 1: Illustration of cells creating a triangulated surface | Figure 2: Illustration cells defining a line |
When working with Points & Cells, just remember that: Points define geometry, Cells define topology .
Point Data & Cell Data
At this point, it should be noted that a complete description of surface or centerline geometry & topology is given by the Point & Cell descriptors; this is similar to the information which might be encoded in a common STL or PLY file. Though undoubtedly useful, the VTK data model allows far more flexibility and customization than these simple descriptors. This flexibility is employed through the use of dataset attributes (ie. Point Data & Cell Data).
Throughout the previous tutorials, we have generated scalar and vector field maps which have been applied to both centerlines and surfaces. These may have come in the form of measuring the surface distance to centerlines in the Mesh Generation tutorial, or generating centerline Group or Tract Ids in the Branch Splitting tutorial. The algorithms that VMTK employs to do these operations stores the resulting attribute data in Point Data / Cell Data arrays associated with the underlying VTK object which is being processed. It is important to note that though both Point Data & Cell Data both act to describe some data attribute of the underlying VTK object, they are not necessarily interchangeable. In general, cell data can be easily converted to point data, but point data may not necessarily be easily converted to cell data - the reason for this (along with the methods to convert cell data to point data) will be illustrated later on in this tutorial.
Point Data refers to a dataset attribute which is specified for every Point in the VTK object. Cell Data refers to a dataset attribute which is specified at every cell in the VTK object. The following example is provided to attempt to make this distinction clear:
If we are given a centerline which has been split into branches (refer to the Branch Splitting tutorial), the Centerline Id, Tract Id, & Group Id of each centerline segment is stored as Cell Data key/value pairs. If we then go on to calculate the centerline geometry (refer to the Geometric Analysis tutorial), the tortuosity values will be stored as Point Data.
In this example the cell data (Centerline Id, Tract Id, etc.) applies the same value - an integer indicating some attribute in this case - to a large number of points which are specified by a single cell. Conversely, a value such a tortuosity inherently varies for every point making up the centerline, and therefore needs to be specified individually for every point.
This explanation all acts to say the following: if a dataset attribute varies for every vertex defining geometry, it is Point Data. If the dataset attribute varies according to the object’s topology , it is Cell Data.
Structured Conversion Between VTK Data and Numpy Arrays
When we want to access VTK data in numpy, we actually need to access the four principle component of a VTK object as described above:
- Points
- Cells
- Point Data
- Cell Data
In order to make use of the data in numpy/python, we create a unique numpy array for every VTK array defining these components. In order to handle these arrays in a manageable fashion (accessible through one python object), we assign each data array to a key/value pair in a (nested) python dictionary of pre-defined structure. The following subsections defines the dictionary structure required for centerlines, images, and surfaces.
Note: The following structure must be reproduced exactly in order to successfully convert a numpy dataset back into VMTK. Be sure to include all dictionary components (even if they are empty) and ensure that all keys exactly match the description below / the output from converting VMTK objects to numpy.
Converting VMTK Surface Objects
The following example demonstrates how to convert a VMTK surface to a numpy array. This is handled by the vmtkscripts.vmtkSurfaceToNumpy() script which accepts a Surface as a input and outputs the nested dictionary of arrays through the ArrayDict class attribute.
The structure of the ArrayDict nested dictionary is as follows:
ArrayDict
    ['Points']                   <-- required, is Nx3 array of N vertexes and x, y, z locations
    ['PointData']                <-- required, even if subarrays are empty
        ['PointDataArray1']      <-- optional, (ex. MaximumInscribedSphereRadius)
        ['PointDataArray2']      <-- optional
        ...
    ['CellData']                 <-- required
        ['CellPointIds']         <-- required, is Mx3 array defines cell conectivity to ['Points] Indices
        ['CellDataArray1']       <-- optional, (ex. CenterlineTractId)
        ['CellDataArray2']       <-- optional
        ...
An example showing the dictionary structure is below:
from vmtk import vmtkscripts
import numpy as np

surfaceReader = vmtkscripts.vmtkSurfaceReader()
surfaceReader.InputFileName = 'foo/neuro-test-surface-distance.vtp'
surfaceReader.Execute()

surfaceNumpyAdaptor = vmtkscripts.vmtkSurfaceToNumpy()
surfaceNumpyAdaptor.Surface = surfaceReader.Surface
surfaceNumpyAdaptor.Execute()

numpySurface = surfaceNumpyAdaptor.ArrayDict
Reading VTK XML surface file.
wrapping vtkPolyData object
converting cell data:
converting points
converting point data:
DistanceToCenterlines
MaximumInscribedSphereRadius
converting cell connectivity list
The python object numpySurface is now a nested dictionary of numpy arrays. The top level key/value pairs are:
numpySurface
{'CellData': {'CellPointIds': array([[     0,      1,      2],
         [     1,      3,      4],
         [     5,      6,      7],
         ...,
         [ 88716,  89180,  37940],
         [166989, 164742, 166803],
         [103381, 110920, 102971]], dtype=int32)},
 'PointData': {'DistanceToCenterlines': array([ 0.83461123,  0.86163944,  0.82509331, ...,  0.19807033,
          1.024342  ,  0.3966704 ]),
  'MaximumInscribedSphereRadius': array([ 0.83021622,  0.85573586,  0.82176147, ...,  0.20746213,
          0.9325247 ,  0.38492678])},
 'Points': array([[  11.95934963,   -3.45995545, -250.88401794],
        [  12.04302216,   -3.48910427, -250.89782715],
        [  11.96973038,   -3.54681206, -250.83029175],
        ...,
        [ -21.8845253 ,   10.9817152 , -242.10021973],
        [  -5.70769596,    0.96210521, -247.94236755],
        [ -24.40606117,    2.56822777, -245.54272461]], dtype=float32)}
For numpySurface, we can see that the numpy of surface points (stored in numpySurface['Points']) and the number of triangles (stored in numpySurface['CellData']['CellPointIds']) is:
print('Number of Points = ', numpySurface['Points'].shape[0], ' Number of Dimensions = ', numpySurface['Points'].shape[1])
print('Number of Faces = ', numpySurface['CellData']['CellPointIds'].shape[0], ' Number of Vertices Per Face = ', numpySurface['CellData']['CellPointIds'].shape[1])
Number of Points =  209988  Number of Dimensions =  3
Number of Faces =  419582  Number of Vertices Per Face =  3
We can also see that the data stored in PointData has the shape:
print('numpySurface["PointData"]["DistanceToCenterlines"] shape = ', numpySurface["PointData"]["DistanceToCenterlines"].shape)
numpySurface["PointData"]["DistanceToCenterlines"] shape = (209988,)
which exactly matches the number of vertices in the Points array. In this case, each index in numpySurface['PointData']['DistanceToCenterlines'] corresponds to a row in ` numpySurface[‘Points’] . ie. numpySurface[‘PointData’][‘DistanceToCenterlines’][100] corresponds to the vertex defined by coordinates at numpySurface[‘Points’][100, :]`
From here, we can modify the location of the points, define a new cell connectivity list, or add a new Point Data or Cell Data array. If we decide we want to modify the DistanceToCenterlines array values by a constant scale factor, we can perform the operation and convert back to a VMTK surface Object by:
print('Before Modification: ', numpySurface['PointData']['DistanceToCenterlines'])
numpySurface['PointData']['DistanceToCenterlines'] = numpySurface['PointData']['DistanceToCenterlines'] * 2
print('After Modification: ', numpySurface['PointData']['DistanceToCenterlines'])

surfaceVmtkAdaptor = vmtkscripts.vmtkNumpyToSurface()
surfaceVmtkAdaptor.ArrayDict = numpySurface
surfaceVmtkAdaptor.Execute()
Before Modification:  [ 0.83461123  0.86163944  0.82509331 ...,  0.19807033  1.024342    0.3966704 ]
After Modification:  [ 1.66922245  1.72327889  1.65018662 ...,  0.39614065  2.048684    0.79334081]
converting points
converting numpy array to surface
We can then use the VMTK object as normal or save it to a file.
Converting VMTK Centerline Objects
The following example demonstrates how to convert a VMTK centerline to a numpy array. This is handled by the vmtkscripts.vmtkCenterlinesToNumpy() script which accepts a Surface / Centerline as a input and outputs the nested dictionary of arrays through the ArrayDict class attribute.
The structure of the ArrayDict nested dictionary is as follows:
ArrayDict
    ['Points']                   <-- required, is Nx3 array of N vertexes and x, y, z locations
    ['PointData']                <-- required, even if subarrays are empty
        ['PointDataArray1']      <-- optional, (ex. MaximumInscribedSphereRadius)
        ['PointDataArray2']      <-- optional
        ...
    ['CellData']                 <-- required
        ['CellPointIds']         <-- required, list of Mx1 arrays defining cell connectivity to ['Points']
        ['CellDataArray1']       <-- optional, (ex: CenterlineTractId)
        ['CellDataArray2']       <-- optional
        ...
Note: The format for ['CellData']['CellPointIds'] is slightly different for centerlines than it is for the surface example above. Unlike a surface (which defined each triangle face as a row in ['CellData']['CellPointIds'] with fixed dimensions Mx3), the number of Points making up each cell in a centerline are completely arbitrary. Instead of a Mx3 size array, the centerline version of ['CellData']['CellPointIds'] contains a list of numpy arrays with (potentially) non-equal sizes. Aside from this semantic difference, the meaning of each index in ['CellData']['CellPointIds'] is the same for centerlines and surfaces; that is, each value in ['CellData']['CellPointIds'] refers to a row index in ['Points'] which contains the coordinates of the associated points.
centerlineReader = vmtkscripts.vmtkSurfaceReader()
centerlineReader.InputFileName = 'foo/coronary-test-centerline-branches.vtp'
centerlineReader.Execute()

clNumpyAdaptor = vmtkscripts.vmtkCenterlinesToNumpy()
clNumpyAdaptor.Centerlines = centerlineReader.Surface
clNumpyAdaptor.Execute()

numpyCenterlines = clNumpyAdaptor.ArrayDict
Reading VTK XML surface file.
wrapping vtkPolyData object
converting cell data:
CenterlineIds
TractIds
Blanking
GroupIds
converting points
converting point data:
MaximumInscribedSphereRadius
converting cell connectivity list
Like the surface example above, we can see that the data accessed through numpyCenterlines['Points'] is a numpy array of shape Nx3:
print('numpyCenterlines["Points"] shape = ', numpyCenterlines['Points'].shape)
numpyCenterlines["Points"] shape = (20758, 3)
In addition, we see that the keys for Point Data and Cell Data are:
print('Point Data Keys: ', numpyCenterlines['PointData'].keys())
print('Cell Data Keys: ', numpyCenterlines['CellData'].keys())
Point Data Keys:  dict_keys(['MaximumInscribedSphereRadius'])
Cell Data Keys:  dict_keys(['CenterlineIds', 'TractIds', 'Blanking', 'GroupIds', 'CellPointIds'])
We see that the number of components in ['PointData']['MaximumInscribedSphereRadius'] is equal to the number of rows in ['Points']
print('Point Data Shape: ', numpyCenterlines['PointData']['MaximumInscribedSphereRadius'].shape, ' = Number of Points: ', numpyCenterlines['Points'].shape[0])
Point Data Shape: (20758,) = Number of Points: 20758
We can also see that ['CellData']['CellPointIds'] is a list of a certain length which contains a series of numpy arrays, and that the sizes of the arrays are not necesarily the same:
print("['CellData']['CellPointIds] is a python list: ", isinstance(numpyCenterlines['CellData']['CellPointIds'], list))
print("length of ['CellData']['CellPointIds'] list = ", len(numpyCenterlines['CellData']['CellPointIds']), '\n')

minSize = np.inf
maxSize = 0
for index, cellId in enumerate(numpyCenterlines['CellData']['CellPointIds']):
    if cellId.shape[0] > maxSize:
        maxSize = cellId.shape[0]
        maxSizeCellIndex = index
    if cellId.shape[0] < minSize:
        minSize = cellId.shape[0]
        minSizeCellIndex = index

print("Minimum size of array in ['CellData']['CellPointIds'] = ", minSize, ' Which occured at index ', minSizeCellIndex)
print("Maximum size of array in ['CellData']['CellPointIds'] = ", maxSize, ' Which occured at index ', maxSizeCellIndex)
['CellData']['CellPointIds] is a python list:  True
length of ['CellData']['CellPointIds'] list =  30

Minimum size of array in ['CellData']['CellPointIds'] =  32  Which occured at index  27
Maximum size of array in ['CellData']['CellPointIds'] =  2950  Which occured at index  7
We can the see that the data inside of ['CellData'] (not at ['CellPointIds']) has a shape equal to the length of the ['CellData']['CellPointIds'] list
for cellDataKey in numpyCenterlines['CellData']:
    if cellDataKey == 'CellPointIds':
        pass
    else:
        print('Shape of ', cellDataKey, ' = ', numpyCenterlines['CellData'][cellDataKey].shape)
Shape of  CenterlineIds  =  (30,)
Shape of  TractIds  =  (30,)
Shape of  Blanking  =  (30,)
Shape of  GroupIds  =  (30,)
This is important, as the data stored in the ['CellData'] arrays are indexed so that the value at ['CellData']['foo'][index] refers to the list element at the corresponding list index in ['CellData']['CellPointIds']. For example: the data sorted at ['CellData']['TractIds'][5] refers to the cell point id list accessible at ['CellData']['CellPointIds'][5]. Recall that this array’s values indicate the row indices of the vertices in ['Points'] which make up the cell. In this way it is possible to map a Cell Data value to a particular Point coordinate.
However, it is not always convenient to have to map each ['CellData']['foo'] index to the ['CellData']['CellPointIds'] list to the corresponding coordinate in ['Points']. A conceptually simpler (though more resource intensive) method to perform the mapping is to take each dataset attribute in ['CellData'] (with the exception of CellPointIDs), and map it to a dense array in ['PointData']. This can be performed automatically by specifying foo.ConvertCellToPoint = 1 when calling vmtkscripts.vmtkCenterlinesToNumpy()
Like the surface example above, it is possible to convert from the nested python dictionary of arrays to a VMTK centerlines object via the vmtkscripts.vmtkNumpyToCenterlines() module:
clVmtkAdaptor = vmtkscripts.vmtkNumpyToCenterlines()
clVmtkAdaptor.ArrayDict = numpyCenterlines
clVmtkAdaptor.Execute()
converting points
converting point data
converting cell data
Converting VMTK Image Objects
The conversion of VMTK Image Objects requires a much simpler ArrayDict structure than for a surface or centerline. The structure of the ArrayDict is as follows:
ArrayDict
    ['Origin']                 <-- required, is 3x1 array of (float) x,y,z vertex locations at index (0,0,0)
    ['Dimensions']             <-- required, is 3x1 array of (int) number of voxels in the x,y,z direction.
    ['Spacing']                <-- required, is 3x1 array of (float) voxel spacing in the x,y,z directions
    ['PointData']              <-- required
        ['PointDataArray1']    <-- required, is np.ndarray of shape = dimensions containing image data.
        ['PointDataArray2']    <-- optional, is np.ndarray of shape = dimensions containing image data.
        ...
Recall that for this module, image data does not have a concept of cell data. As a result the entire VTK object can be specified with 3 attributes (Origin, Dimensions, & Spacing) and a dense array representing the image intensity scalars at each voxel index. An example of this is shown below:
imageReader = vmtkscripts.vmtkImageReader()
imageReader.InputFileName = 'foo/aorta-voi.mha'
imageReader.Execute()

imageNumpyAdaptor = vmtkscripts.vmtkImageToNumpy()
imageNumpyAdaptor.Image = imageReader.Image
imageNumpyAdaptor.Execute()

numpyImage = imageNumpyAdaptor.ArrayDict
Spacing 0.878906 0.878906 1.500090
Origin 156.445000 24.609400 0.000000
Dimensions 157 393 34
wrapping vtkDataObject
setting origin
setting dimensions
setting spacing
writing point data:
print("['Spacing'] = ", numpyImage['Spacing'])
print("['Origin'] = ", numpyImage['Origin'])
print("['Dimensions'] = ", numpyImage['Dimensions'])
print("['PointData']['ImageScalars'] shape = ", numpyImage['PointData']['ImageScalars'].shape)
['Spacing'] =  [ 0.87890601  0.87890601  1.50009   ]
['Origin'] =  [ 156.445    24.6094    0.    ]
['Dimensions'] =  [157 393  34]
['PointData']['ImageScalars'] shape =  (157, 393, 34)
We can modify the data stored in ['PointData']['ImageScalars'] and return it to a VMTK image object as demonstrated below:
print('Intensity Maximum Before Modification = ', np.amax(numpyImage['PointData']['ImageScalars']))
print('Intensity Minimum Before Modification = ', np.amin(numpyImage['PointData']['ImageScalars']))

numpyImage['PointData']['ImageScalars'][np.where(numpyImage['PointData']['ImageScalars'] > 500)] = 500

print('Intensity Maximum After Modification = ', np.amax(numpyImage['PointData']['ImageScalars']))
print('Intensity Minimum After Modification = ', np.amin(numpyImage['PointData']['ImageScalars']))
Intensity Maximum Before Modification =  2570.2
Intensity Minimum Before Modification =  0.0
Intensity Maximum After Modification =  500.0
Intensity Minimum After Modification =  0.0
imageVmtkAdaptor = vmtkscripts.vmtkNumpyToImage()
imageVmtkAdaptor.ArrayDict = numpyImage
imageVmtkAdaptor.Execute()
Converting Numpy Array to vtkImageData
converting point data
Saving VMTK Numpy Objects
Two convenience scripts have been provided to save and read VMTK numpy objects (surfaces, centerlines, or images) to disk. The files can be written in either HDF5 format (provided the h5py module is installed) or via a standard python pickle object. The procedure is identical for every object type.
Simply use vmtkscripts.vmtkNumpyWriter() and vmtkscripts.vmtkNumpyReader() in the fashion standard through vmtk. The scripts take an ArrayDict as an input member along with a Format identification (default = pickle) and a output/input file name, and read/write the array to/from disk.


